Our Water
Monitoring and Data Collection
-Introduction 
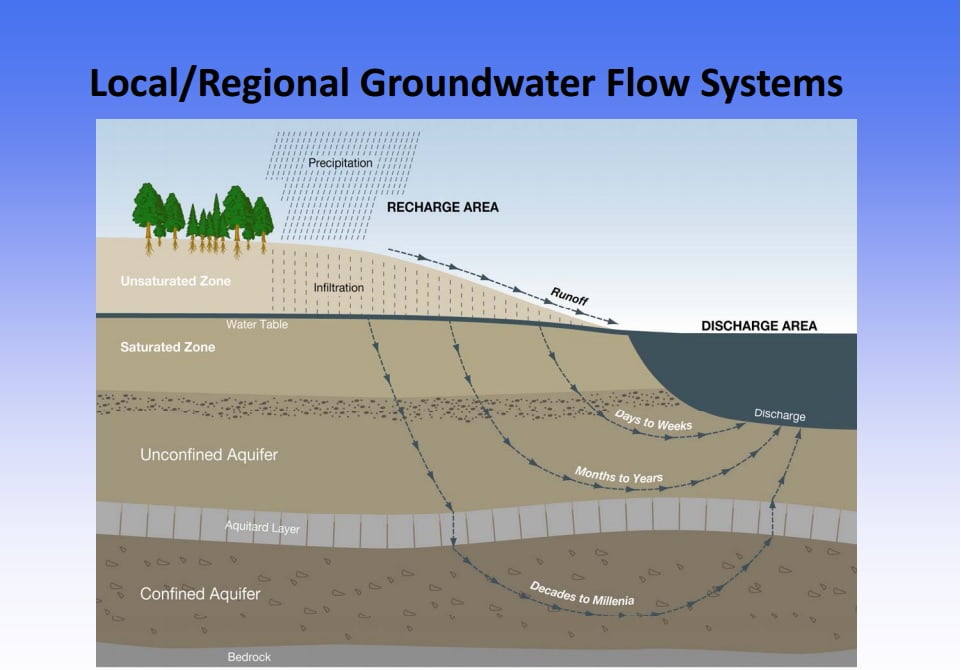
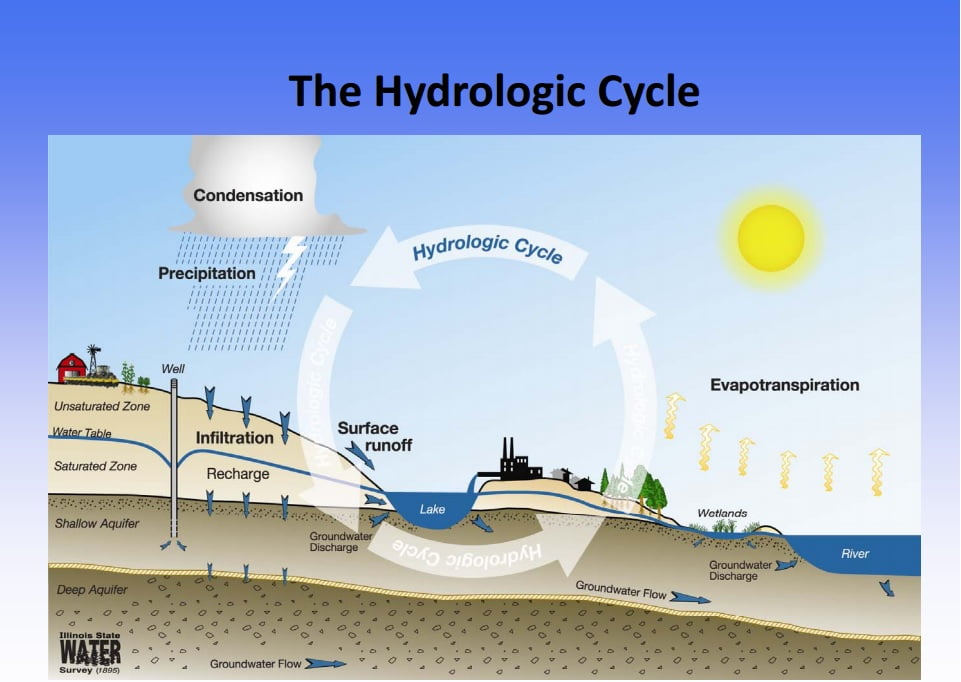
Recharge is the term used to describe how an aquifer gains water from the surface (precipitation, rivers, etc.) or the subsurface (other aquifers). When an aquifer is recharging, groundwater levels rise to be closer to the ground surface, and artesian pressure generally increases. The PCGCD is tracking factors related to recharge such as precipitation (rainfall, snow, etc.) and water levels in water wells.
Panola County is in the outcrop of the Carrizo-Wilcox aquifer, also referred to as the recharge zone of the Carrizo-Wilcox. This means that some of the geologic formations which store groundwater are oriented so that they intersect the ground surface in such a way that they are “open ended” and can receive water from the surface. This is good news for us in that the aquifer will recharge faster than in non-outcrop areas, but it is bad news in that there is a higher risk of groundwater contamination from surface sources.
In recent hydrogeological studies, however, the District has determined that many wells in the county display water level changes that represent a confined aquifer (groundwater under pressure). Also, flowing springs in the county are another indicator of confined aquifer conditions. So, it appears that the Carrizo-Wilcox here is a hybrid of the two types. This means that when groundwater levels fluctuate, it probably is due to changes in aquifer pressure rather than rapid emptying or filling of the aquifer.

Rain Gauges
The PCGCD has 5 rain gauges in Panola County, located in Deadwood, DeBerry, Rock Hill, Clayton, and Carthage. At the end of each month, the precipitation recorded by each gauge is averaged to give an approximate rainfall amount for the county. In the graphs below, the data recorded by the PCGCD are compared to what is reported by the National Oceanic and Atmospheric Administration (NOAA) for our area.
Panola County Precipitation Since 2011
In the link below is a graph of the annual cumulative precipitation totals for the Carthage weather station, dating back to the 1950s, courtesy of the Southern Regional Climate Center. This graph provides interesting insight into our local wettest years, driest years, and long-term patterns.
Carthage Precipitation Since 1952
Drought Monitoring
Drought is a major influence on all water sources. When precipitation becomes sparse, surface water and groundwater conservation remain crucial in meeting water demands. Provided below is a link to the U.S. Drought Monitor for Texas, a useful tool for tracking state and local drought conditions week-to-week.
Current Status of Panola County: DO Abnormally Dry
The U.S. Drought Monitor is produced through a partnership between the National Drought Mitigation Center at the University of Nebraska-Lincoln, the United States Department of Agriculture, and the National Oceanic and Atmospheric Administration.
Monitor Wells
The PCGCD currently has 58 monitor wells spaced throughout the county which are used to measure water levels once each month. The Texas Water Development Board has 15 annual monitor wells in Panola County, all of which have been adopted by the District in order to supplement our database. Below are links to graphs showing the average change in water levels county-wide each month and each year.
Monthly Monitor Wells Since 2011
PCGCD 2025 Monthly Monitor Wells
PCGCD 2024 Monthly Monitor Wells
PCGCD 2023 Monthly Monitor Wells
PCGCD 2022 Monthly Monitor Wells
PCGCD 2021 Monthly Monitor Wells
PCGCD 2020 Monthly Monitor Wells
PCGCD 2019 Monthly Monitor Wells
PCGCD 2018 Monthly Monitor Wells
PCGCD 2017 Monthly Monitor Wells
PCGCD 2016 Monthly Monitor Wells
PCGCD 2015 Monthly Monitor Wells
PCGCD 2014 Monthly Monitor Wells
PCGCD 2013 Monthly Monitor Wells
PCGCD 2012 Monthly Monitor Wells
PCGCD 2011 Monthly Monitor Wells
Each year, the Texas Water Development Board (TWDB) collects water level data from nearly 2,000 wells, tracking the changes in all 30 major and minor aquifers across the state. Through collaborative efforts with 50 groundwater conservation districts, the US Geological Survey, municipalities, and well owners, over 10,000 measurements are recorded annually in the TWDB groundwater database. In Panola County, the TWDB has checked about 15 monitor wells annually since the 1970s. This dataset provides valuable local context about the Carrizo-Wilcox aquifer’s progression through the years.
Recharge
Pages 7-8 of the District Management Plan information from the Texas Water Development Board pertaining to recharge.
Total recharge from precipitation for the Carrizo-Wilcox is 25,771 acre-feet per year.
Total discharge from the aquifer to the surface (springs, lakes, rivers, etc.) is 5,939 acre-feet per year.
Total flow into the District via the subsurface: 3,319 acre-feet per year.
Total flow out of the District via the subsurface: 1,014 acre-feet per year.
Net hydrologic gain (not accounting for pumping): 22,137 acre-feet per year.
Additional links:
Underground Injection Control; AR & ASR
Enhancing Groundwater Recharge
Rainwater Harvesting: Soil Storage and Infiltration
(Credit to the Illinois State Water Survey for the first two graphics at top of page)

